
From Failed Challenge to Funded Trader: A Tour of the Funding Hub
A walkthrough of the Funding Hub in EdrisFinance. What each section actually does, how to use it to pick a firm, plan a challenge, and stop bleeding capital on rules you never read carefully.
Most people who fail prop challenges don't fail because their trading is bad. They fail because they forgot a rule, miscounted a daily loss, sized into a correlated position, or held overnight without checking the swap policy. The strategy was fine. The accounting around it wasn't.
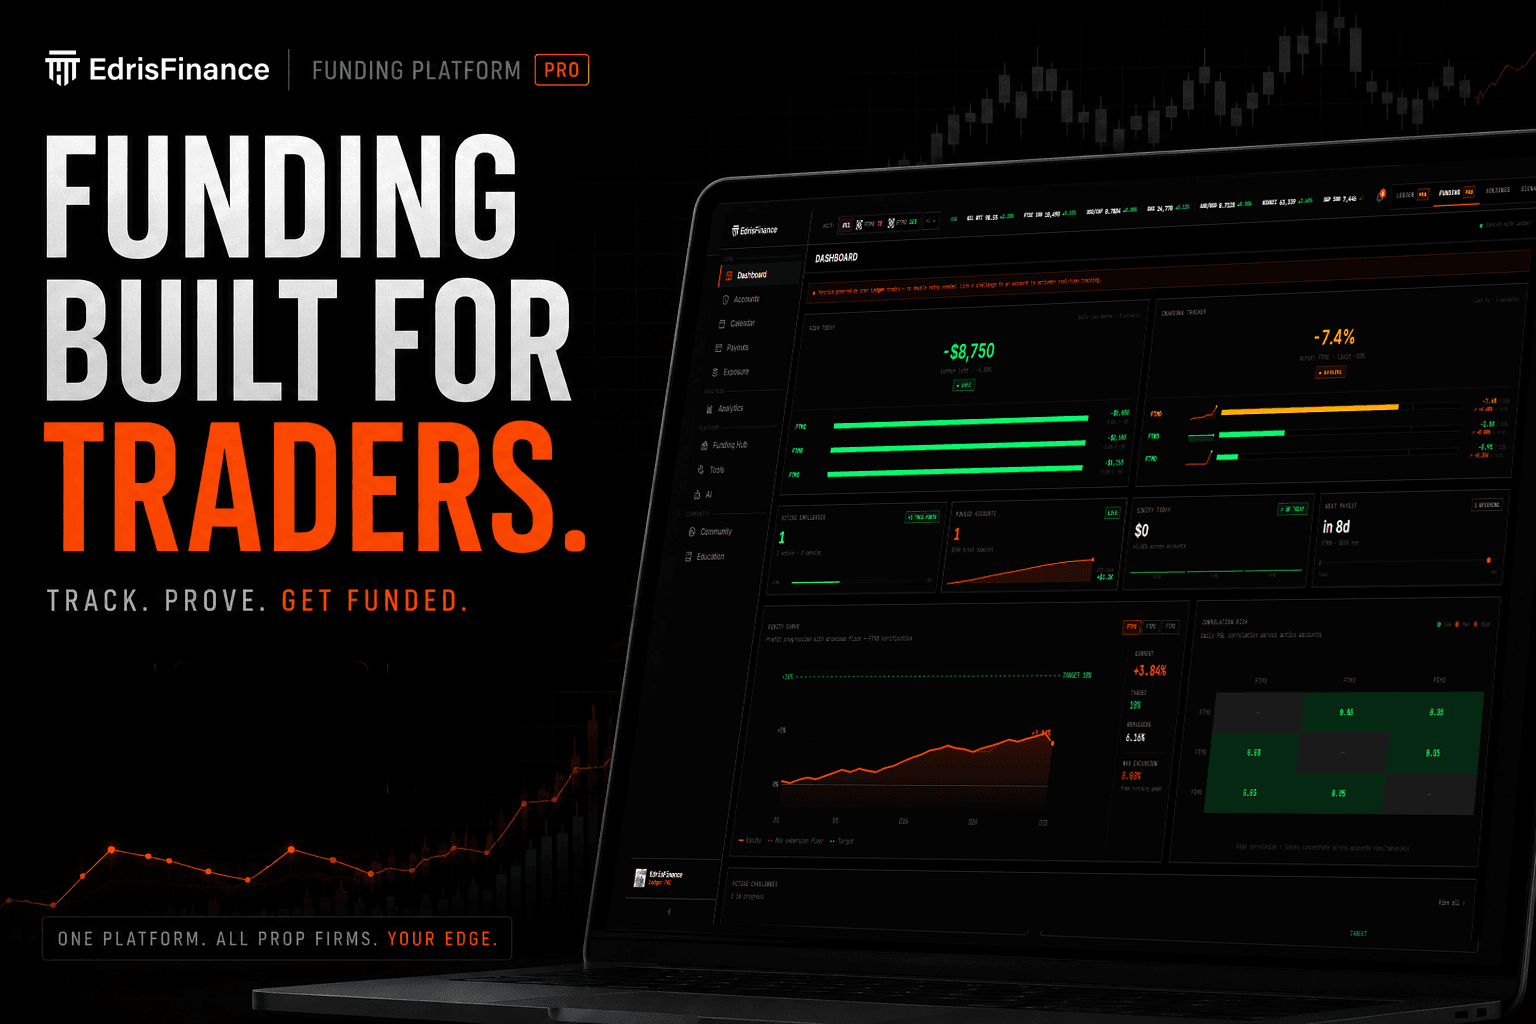
Funding Hub is the part of EdrisFinance built for that gap. It's where you pick a firm, plan the challenge before you pay for it, then track every rule and number in one place until the payout hits your account.
This is a walkthrough of the sections traders actually use. What's in them, how to read them, and what to do with what you see.
What is Funding Hub
Funding Hub sits next to Ledger inside EdrisFinance. Your trades come in once — from MetaTrader, cTrader, your prop firm's platform, or a CSV — and the same trade history powers both the journal and the prop firm tracking. No double entry, no syncing your numbers twice.
It's available to every Ledger PRO subscriber. There's no separate plan to buy, no per-account fee, no firm-by-firm setup. You add a challenge, link it to the trades that belong to it, and the rest is automatic.
The sections worth knowing:
- Prop Firms catalog
- Accounts
- Dashboard
- Calendar
- Payouts
- Analytics
Here's how each one works.
1. Prop Firms — Pick the firm before you pay
Most traders pick a prop firm by watching a YouTube ad, reading two Reddit threads, and clicking the affiliate link in the description. Funding Hub gives you the same thing without the marketing.
You get every supported firm in one table. FTMO, FundedNext, FundingPips, E8, FXIFY, Topstep, FunderPro, GOAT, My Funded FX, The5ers, Maven, Apex — twenty-six firms at last count, with new ones added as they pass our vetting. For each one you see the category (Forex, Futures, Crypto, Multi-Asset), the model (1-step, 2-step, instant), the fee range, the profit target, the max drawdown, the profit split, the fastest payout window, and a rating built from real trader reviews — not the firm's own marketing page.
The filters do the work most people skip. If you only want 1-step Forex firms with a payout in 5 days or less, two clicks gets you there. If you want every firm offering a Crypto challenge under $100, same thing.
Sort by rating once. Look at the top five. That's your shortlist. Don't read a single ad until you've done that.
2. Accounts — One screen for every challenge you're running
Once you've signed up with a firm, the account lives in this section. You'll see every challenge you have open — funded, in verification, failed, archived — with the current state of each on the same screen.
For each account you get a card. P&L since start, win rate, trade count, and a small equity curve that tells you in one glance whether you're climbing or sliding. A green curve trending up means the challenge is working. A red one flat or down means the challenge is in trouble, and the longer you wait to look, the worse it gets.
Above the cards there's a strip with the totals. Net account P&L across everything you're running, average win rate, average profit factor, your best-performing account. Useful if you're running three or four challenges at once and want to know whether the portfolio is working as a whole — not just the one you stared at this morning.
The detail view on each card opens into the rule layer: daily loss buffer, total drawdown remaining, days elapsed vs days allowed, scaling milestones, breach risk. If you've ever closed a position thinking "I'm probably fine on daily loss" and found out at 5pm that you weren't, this view is what fixes that habit.
See it in action
This is a walkthrough of Funding Hub from our channel — the same sections, but live with real accounts and real numbers.
3. New Account modal — Plan the challenge before you start it
This is the one most traders skip. They sign up with a firm, get the credentials, and start trading the same day. Then halfway through the challenge they realize they don't remember whether the daily loss is calculated on equity or balance, whether there's a consistency rule, or what the scaling plan looks like at month two.
The New Account modal walks you through every parameter the firm enforces. Pick the challenge size and step (you'll see the firm's actual pricing inline — $79, $199, $446, etc., so you can compare without leaving the page). Then you fill in the parameters that matter:
- Profit target (%)
- Max daily loss (%)
- Max total drawdown (%)
- Profit split (%)
- Minimum / maximum trading days
- Consistency rule (with the % of profit allowed from your best day)
- Allowed trading hours in UTC
- Scaling plan, if the firm has one
Every number you enter here becomes a guardrail. The Dashboard reads from it. The alerts read from it. The breach risk in the Accounts view reads from it. If you skip a field, you're trading without that guardrail. Fill them all in once, at the start, and you never think about the rules again until something is about to go wrong.
This is the five minutes that separates traders who pass and traders who fail because of an unread footnote.
4. Dashboard — What's broken and what's working today
The Dashboard is the section you open every morning before you trade. It tells you, in about ten seconds, whether you can trade today and how much room you've got.
Risk Today shows your daily loss buffer across every account that's active. If you blew through $7,815 of buffer yesterday and you've got $4,400 left before you breach, you'll see it here — not after you take the trade. Drawdown Tracker does the same thing for total DD, but with a per-account breakdown so you know which challenge is closest to the edge.
Below that you've got the operational tiles. Active Challenges (how many are running, how many in passing range). Funded Accounts (how much capital is live and trading). Equity Today (your day so far across the whole portfolio). Next Payout (the date and the account, so you can stop calculating it on the back of a napkin).
The Equity Curve and Correlation Risk panels are the strategic part. The curve shows you the shape of the challenge so far against your target — if you're trending toward the target, fine. If you've gone flat or down, the chart shows it before the firm sends you the breach email. The correlation matrix shows you which of your active accounts are moving together. If you're trading the same setup on three accounts and they're 0.9 correlated, that's not three challenges — that's one bet sized 3x. Useful to know before you take the trade, not after.
5. Calendar — When and what
Calendar is two things in one. It's a P&L calendar over your funded trading — green days, red days, days you didn't trade — and it's a layer of macro events on top. NFP, CPI, central bank decisions, earnings if you trade equities.
Most firms have a no-news-trading rule. Most traders forget which day NFP falls on. Calendar puts both on the same screen, with a flag on every event and a small window around it where the rule applies. If you're about to enter at 14:25 UTC on a Friday and there's a release at 14:30, the calendar tells you. The breach doesn't have to.
The view also shows the days you've used vs days remaining on each challenge, so you don't get to day 29 of a 30-day window with the target still 5% away.
6. Payouts — The end of the cycle nobody plans for
Once an account is funded and you've made profit, the payout becomes its own piece of admin. Payouts tracks everything about that side of the business: when each payout request was made, when it cleared, what the gross was, what the net was after the split, and whether you're inside the firm's payout window.
There's a running total for the year (gross, net, after-split), per-account breakdowns, and the next eligible payout date for every funded account you've got. If a firm has a holding period — eight days, fourteen days, whatever — Payouts counts it down for you.
For traders running multiple funded accounts this section quietly turns into the most important one. Once you're past the challenge phase, the only thing that matters is the cadence of withdrawals, and the only thing that hurts more than a missed payout is realizing two weeks later that you missed it because you forgot the window.
7. Analytics — Are you trading well or just lucky?
Analytics is the deep section. Six sub-tabs: Performance, Risk, Consistency, Sessions, Prop Rules, Projections. Most traders open Performance and stop there. That's fine — Performance has most of what you need.
You get Net P&L, Expectancy, Profit Factor, Sharpe, Sortino, average R:R, and the Equity Intelligence panel — a smoothed view of your equity curve with Curve Smoothness, Growth Velocity, Max Runup, and the Trader Archetype the system thinks you are based on the shape of your trading.
The number to look at first is Expectancy. It's how much one average trade is worth to you. If Expectancy is positive and stable, your edge is real. If it's flipping between positive and negative month to month, you're trading variance, not a system.
The second is Curve Smoothness, scored out of 100. Most retail trading clocks in around 40-60. Anything above 90 is institutional-quality consistency. The number doesn't lie because it's measuring shape, not outcome — a trader who makes the same return with a smoother curve has more edge than one who got there with cliffs and recoveries.
The P&L Distribution histogram and the R:R CDF underneath are the diagnostic pair. Distribution tells you where most of your trades cluster (small wins, small losses, the occasional outlier). The CDF tells you the percentage of your winners that close below 1R — because if 34% of your "winners" closed for less than the risk you took, that's not a win rate problem, that's a target-setting problem.
Long vs Short tells you which side you actually have an edge on. Most traders find out here that they're a 70% long trader pretending to be neutral. Knowing that lets you size differently.
The other sub-tabs — Risk, Consistency, Sessions, Prop Rules, Projections — are for the deep monthly review. Open them at end of month, not every day.
How to actually use Funding Hub
Seven sections is a lot. You don't open all of them daily. The cadence that works:
- Before you buy a challenge: Prop Firms catalog, filter, shortlist. Then New Account modal to model the challenge before you pay.
- Every morning before trading: Dashboard. Risk Today, Drawdown Tracker, Correlation. Sixty seconds.
- Every Sunday: Accounts overview, Calendar for the week ahead.
- End of month: Analytics — Performance and one other sub-tab. Find one thing to fix for next month.
- When a payout is due: Payouts. Confirm the window, request, log it.
That's it. The hub doesn't make you a better trader on its own. It removes the operational reasons you fail challenges so the only thing left is whether your trading is good enough — which is the question you wanted to be answering all along.
The point
A prop firm challenge is a tight ruleset wrapped around your trading. Most traders fail because they're fighting the ruleset and the market at the same time. Funding Hub takes the ruleset off the table — every parameter is tracked, every limit is visible, every event that matters is on the same screen — so the only fight left is the one with the chart.
If you're running one challenge, it'll save you the breach you weren't expecting. If you're running four, it'll save you the chaos that comes from trying to track them across four different broker dashboards and one notebook.
Open Funding Hub. Pick a firm. Plan the challenge. Then trade it.
Start tracking your trades for free
Import your trades from MetaTrader, Binance, and 40+ brokers. Get instant analytics and AI-powered weekly insights.
Get started free →