Win Rate vs Risk/Reward Ratio: Why Most Traders Focus on the Wrong Metric
Most traders obsess over win rate. But win rate alone tells you almost nothing about profitability. Here's how to think about win rate and risk/reward ratio together — and why the combination is what actually matters.
Most traders, when they start out, want to know one thing: "What's my win rate?"
It feels intuitive. If you win more than you lose, you're a good trader, right?
Not exactly. Win rate is one of the most misunderstood metrics in trading — and obsessing over it without understanding its relationship to risk/reward can lead you to make decisions that quietly destroy your account.
This article explains how win rate and risk/reward ratio actually work together, why you can be profitable with a 40% win rate, and why a 70% win rate can still result in consistent losses.
What Is Win Rate?
Win rate is simply the percentage of your trades that close in profit.
If you take 100 trades and 55 of them are winners, your win rate is 55%.
It says nothing about how much you make when you win or how much you lose when you lose. And that's the problem with using it in isolation.
What Is Risk/Reward Ratio?
The risk/reward ratio (R:R) compares the potential loss on a trade to the potential gain.
If you risk $100 to potentially make $200, your R:R is 1:2.
If you risk $100 to potentially make $50, your R:R is 1:0.5 — meaning you need to win twice as often just to break even.
Why Win Rate Alone Is Meaningless
Here's a simple example that shows why win rate tells you nothing without context.
Trader A has a 70% win rate. Sounds great. But every winner makes $50 and every loser costs $200.
Trader B has a 40% win rate. Sounds terrible. But every winner makes $300 and every loser costs $100.
Let's run the numbers on 100 trades each:
Trader A (70% win rate, 1:0.25 R:R):
- 70 winners × $50 = $3,500
- 30 losers × $200 = -$6,000
- Net result: -$2,500
Trader B (40% win rate, 1:3 R:R):
- 40 winners × $300 = $12,000
- 60 losers × $100 = -$6,000
- Net result: +$6,000
Trader B, with a 40% win rate, makes significantly more than Trader A with a 70% win rate. This is not a trick. This is how trading actually works.
Expectancy: The Metric That Actually Matters
The concept that ties win rate and risk/reward together is called expectancy. It tells you, on average, how much you can expect to make (or lose) per trade.
The formula is:
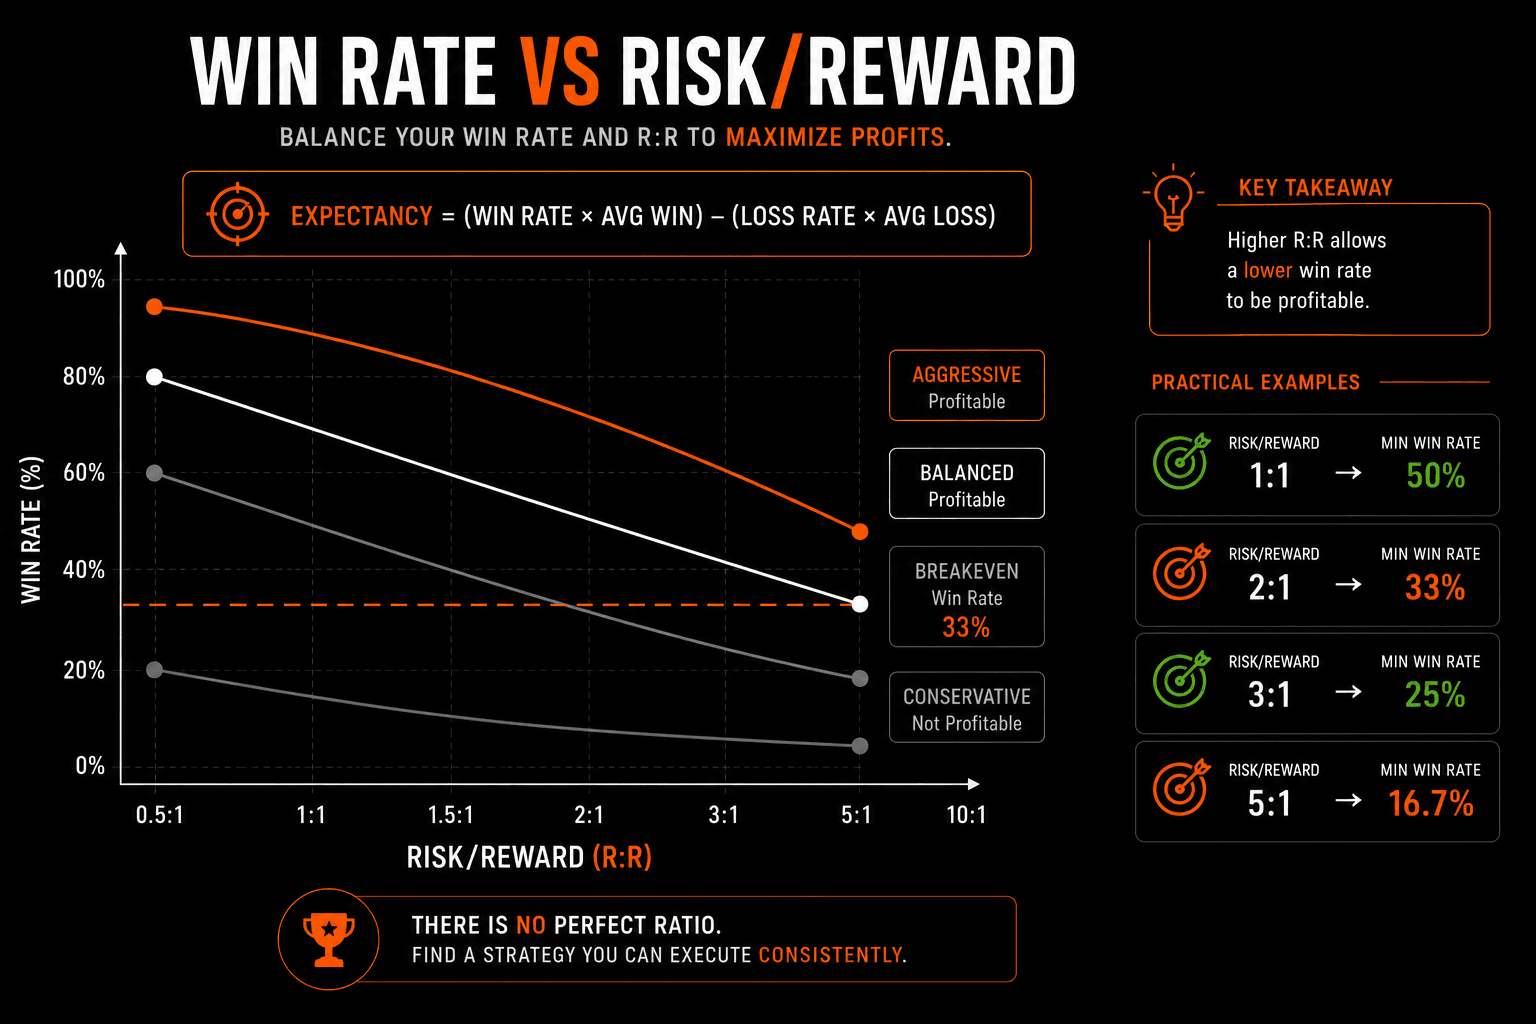
Expectancy = (Win Rate × Average Win) – (Loss Rate × Average Loss)
Using the examples above:
- Trader A: (0.70 × $50) – (0.30 × $200) = $35 – $60 = -$25 per trade
- Trader B: (0.40 × $300) – (0.60 × $100) = $120 – $60 = +$60 per trade
Positive expectancy means profitable in the long run. Negative expectancy means you'll lose money regardless of how many trades you take.
This is the number you should be calculating, not just your win rate.
The Tradeoff Between Win Rate and R:R
Win rate and R:R have an inverse relationship. When you aim for a higher R:R (letting winners run further), your win rate typically drops. When you tighten your targets and take smaller profits quickly, your win rate rises.
Neither approach is inherently better. What matters is that your combination produces positive expectancy.
Here's a rough guide to the win rates needed to break even at different R:R ratios:
| Risk/Reward Ratio | Break-Even Win Rate |
|---|---|
| 1:0.5 | 67% |
| 1:1 | 50% |
| 1:1.5 | 40% |
| 1:2 | 33% |
| 1:3 | 25% |
A 1:3 R:R only requires you to be right 25% of the time to break even. Win 30% of the time with that setup and you're profitable. Meanwhile, a trader with a 60% win rate and a 1:0.5 R:R is slowly going broke.
Why Traders Get Obsessed With Win Rate
There's a psychological reason most traders gravitate toward high win rates: losses hurt more than equivalent gains feel good.
This is well-documented in behavioral economics — losses are psychologically around twice as impactful as gains of the same size. So traders naturally drift toward strategies that minimize the number of losses, even if that means smaller winners.
The result is the classic mistake: cutting winners short and letting losers run. You close a winning trade early to "lock in" the profit. You hold a losing trade hoping it'll come back. Your win rate stays high, but your average loss grows larger than your average win.
High win rate, negative expectancy.
What a Healthy Trading System Looks Like
A sustainable trading system doesn't need an impressive win rate. It needs consistent expectancy.
Some professional traders operate with 35-45% win rates and do well because their average winner is significantly larger than their average loser. Others use systems with 60%+ win rates but keep tight R:R ratios around 1:1 to 1:1.5.
What they all share is a clear understanding of their numbers — and a setup that tilts expectancy in their favor.
Some questions worth asking about your own trading:
What is my actual average win vs. average loss? Not the planned R:R — the actual numbers from your trade history.
Is my expectancy positive or negative? If you don't know, you should find out before taking another trade.
Am I consistently closing winners before they hit target? This is a sign you're managing for win rate at the expense of R:R.
Am I holding losers past my stop? This is the other side of the same problem.
The Real Role of Win Rate
Win rate isn't useless — it's a valuable input. A very low win rate (below 30%) requires very large R:R ratios to stay profitable, which means longer losing streaks that test your psychology and your bankroll. A higher win rate provides more consistent feedback that your setup is working.
Where win rate really matters is in drawdown management. Two trading systems with identical expectancy can have very different risk profiles depending on how the wins and losses are distributed. A lower win rate strategy can have longer losing streaks even when the expectancy is positive — and you need to be emotionally and financially prepared for that.
Understanding this helps you choose a strategy that matches not just your edge, but your temperament.
Tracking the Numbers That Matter
Most traders track trades in spreadsheets and only look at total P&L and win rate. That's not enough. You need:
- Average win amount and average loss amount
- Calculated expectancy per trade
- Maximum consecutive losses (to understand your drawdown exposure)
- R:R achieved vs. R:R planned (reveals if you're cutting winners early)
With EdrisFinance, every trade you import automatically feeds into performance reports that break down these metrics. You can see your actual average win vs. average loss, your win rate per strategy or symbol, and whether your edge is consistent over time — or whether it's drifting.
Analyze your trading metrics for free →
Summary
Win rate is not a reliable measure of trading quality. A 40% win rate can outperform a 70% win rate. What matters is the combination of win rate and risk/reward ratio — and whether that combination produces positive expectancy.
The traders who focus on maximizing win rate at the expense of R:R are often the ones who never figure out why their account isn't growing despite feeling like they're right most of the time.
Track your expectancy. Know your average win and average loss. Build a system where the math works in your favor — and let the win rate be whatever it needs to be.
Start tracking your trades for free
Import your trades from MetaTrader, Binance, and 40+ brokers. Get instant analytics and AI-powered weekly insights.
Get started free →